Watch Dog:
A prediction of San Francisco Crime
[Spatial Analytics] [Python] [Machine Learning] [Folium]
Heavily involved in entire process of exploring data, developing visualizations, creating features, and buidling classifiers.
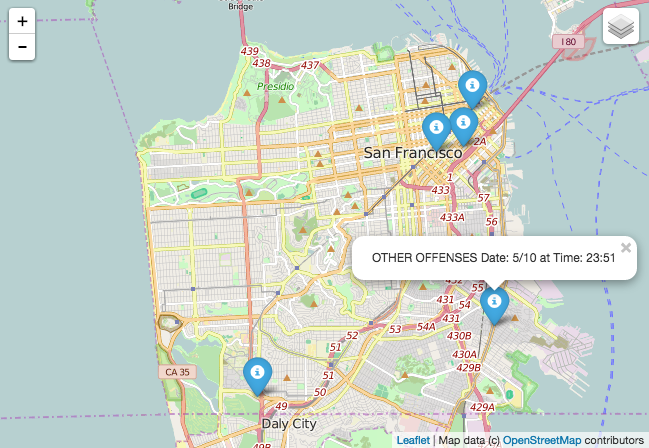
San Francisco experiences no shortage of crime. A mixture of growing social and economic inequalities, housing disparity, and urban complexity all add to this unique problem. The City of San Francisco, in an effort to gain insight into and fight against crime, has solicited public assistance by publishing nearly 12 years of crime reports onto SFOpenData and developing a Kaggle competion with now nearly 900 teams across the country. Our goal was to predict the category of crime that would occur given a location and time.
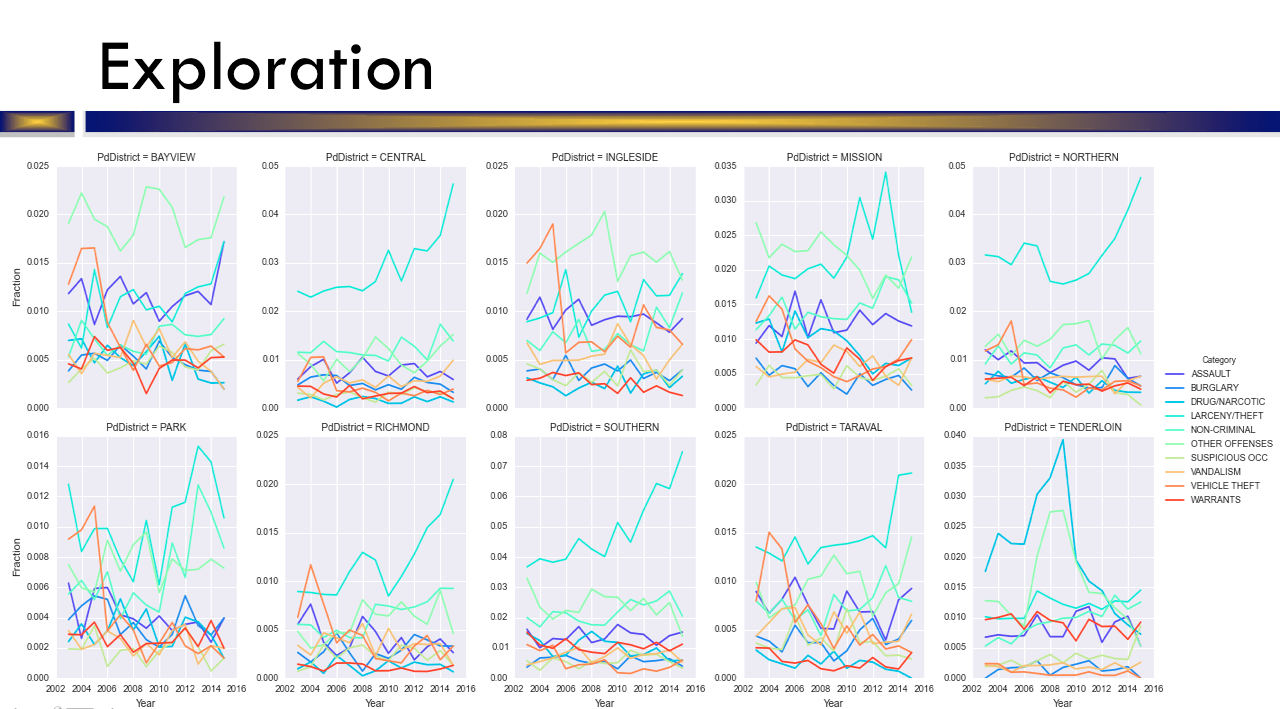
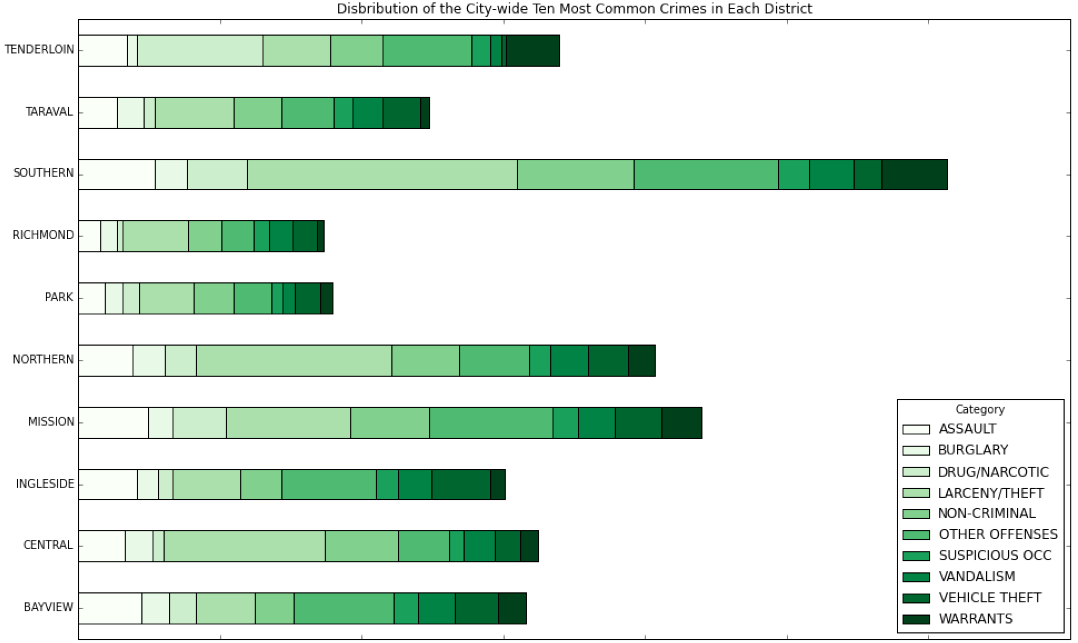
There were a total of 38 crimes we attempted to accurately predict, as categorized by the City of San Francisco Police Department, with a training set of over 800,000 instances. Due to the large amount of data, we focused much of our preliminary exploratory work on viusalizing our data. Many of our initial assumptions were correct. As expected, the Southern district dominated the other districts in frequency of crime across the board. In similar fashion, Richmond and Park were the two safest districts. However, many assumptions were wrong as well. For instance, we visualized the ten most committed crimes by time of day. Non-criminal activity was more rampant in the morning than at night while larceny and theft remained consistent throughout the day. Aassault, surprisingly, was much less frequent during the night as compared to other times of the day. We were less biased and more rigorous in further work. This proved to be invaluable in our following analyses.
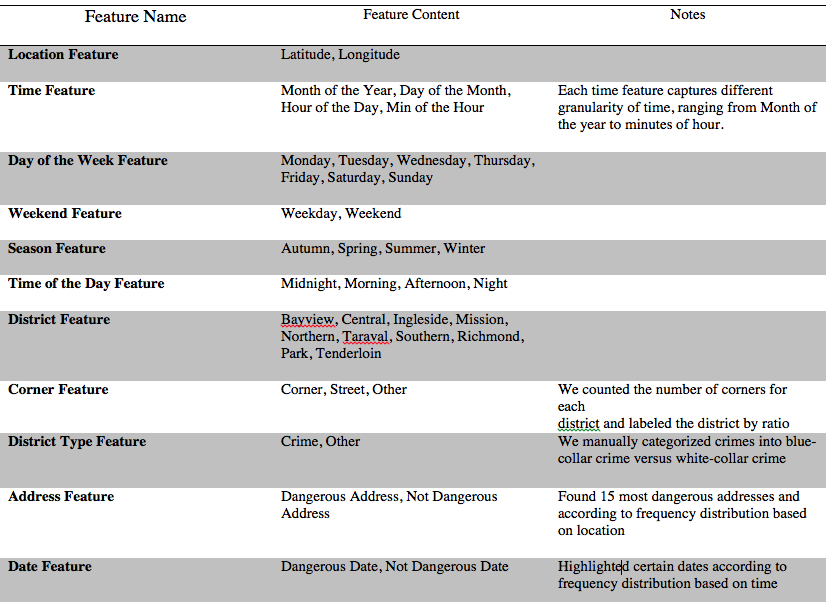
Due to the granularity of the data we focused our efforts on creating more abstract levels of categorization. We created seasonal features, district type features, dangerous address features, dangerous data features, and an array of other features purely based on time. In addition to the ingenuity of more generalized features, we needed to figure out the appropriate level of abstraction of these categories. For example, the ‘Time of Day’ feature was extracted from the original date time feature (as given by MM/DD/YYYY : %H%M%S). Partitioning the time of day into four buckets (as given by Morning, Afternoon, Night, Midnight) produced better results just with the intuition of what we thought constituted the time of day. Using simple histograms, however, we discovered a different story in the data. We continually refined our features in a similar fashion by examining our data to make informed decisions.
We partitioned our data into folds of training sets and test sets using cross validation. The goal of the project would then be to train on our entire dataset, and given a set of new locations and times provide probablities for each of the 38 crimes. We created a pipeline using three different classifiers (Logistic Regression, BernoulliNB, and XGBClassifier) and fine-tuned each classifier using Grid Search. At the moment, we’re ranked in the top 60 out of nearly 900 contestants.
The exploratory work and feature creation were the most difficults parts of this project. Because the competition only offered data on location and time, though to differing degrees, much of the ingenuity came from discovering high variance features and creating categories for new features. Therefore, we spent the vast majority of our time performing exploratory work and refining our approach iteratively. Moving forward, we could do more work with fine-tuning our classifiers. There is also the possibility of acquiring data from outside sources, such as major events, housing and income information, and additional data from the police. Our model could also be used for re-allocating police resources effectively (ie, to areas which need more personal or equipment of a certain type)
Group Members: Daniel Chen
Follow the Project on GitHub home